oscillator vs indicators
indicators
Oscillators: Rather than being overlaid on a price chart, technical indicators that oscillate between a local minimum and maximum are plotted above or below a price chart. Examples include the stochastic oscillator, MACD, or RSI.
- Relative strength index (RSI)
- Moving average convergence divergence (MACD)
- Bollinger Bands
Best trading indicators
- Moving average (MA)
- Exponential moving average (EMA)
- Stochastic oscillator
- Moving average convergence divergence (MACD)
- Bollinger bands
- Relative strength index (RSI)
- Fibonacci retracement
- Ichimoku cloud
- Standard deviation
- Average directional index
Moving average (MA)
The MA – or ‘simple moving average’ (SMA) – is an indicator used to identify the direction of a current price trend, without the interference of shorter-term price spikes.
200-day MA requires 200 days of data
Exponential moving average (EMA)
The most popular exponential moving averages are 12- and 26-day EMAs for short-term averages, whereas the 50- and 200-day EMAs are used as long-term trend indicators.
Fibonacci retracement is an indicator that can pinpoint the degree to which a market will move against its current trend. A retracement is when the market experiences a temporary dip – it is also known as a pullback.
The Ichimoku Cloud, identifies support and resistance levels. However, it also estimates price momentum and provides traders with signals to help them with their decision-making.
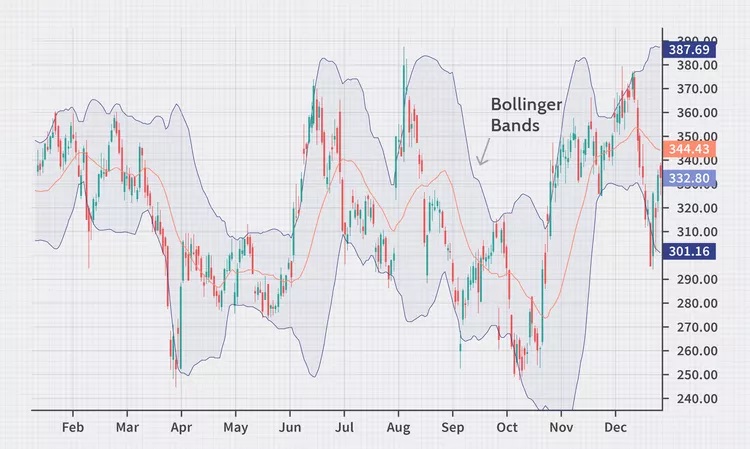
Bollinger Band
typically use a 20-day moving average.
The upper and lower bands are typically 2 standard deviations +/- from a 20-day simple moving average and can be modified.
typically using a 20-day SMA. A 20-day SMA averages the closing prices for the first 20 days as the first data point
squeeze signals a period of low volatility and is considered by traders to be a potential sign of future increased volatility and possible trading opportunities.
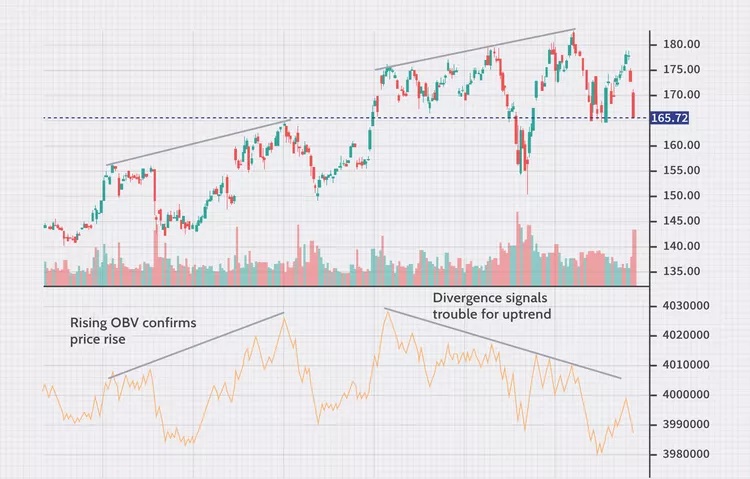
On Balance Volume (OBV)
measures buying and selling pressure as a cumulative indicator that adds volume on up days and subtracts volume on down days.
measure the positive and negative flow of volume in a security over time.
If the price is rising but OBV is falling, that could indicate that the trend is not backed by strong buyers and could soon reverse.
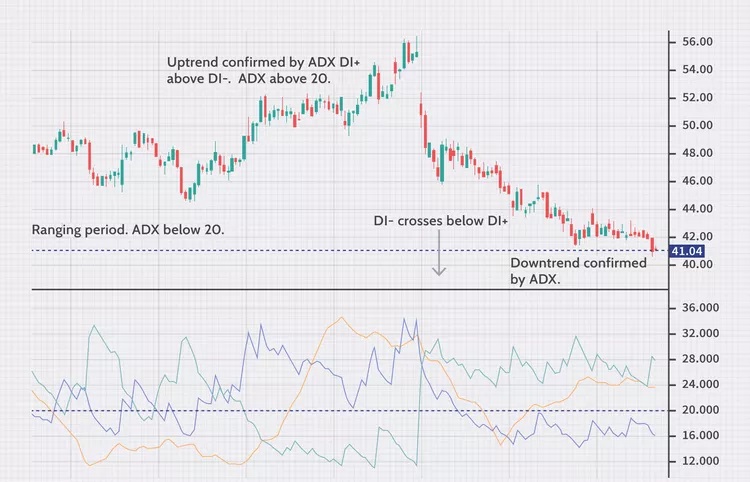
Average Directional Index ADX
measure the strength and momentum of a trend.
The ADX is the main line on the indicator, usually colored black. There are two additional lines that can be optionally shown. These are DI+ and DI-. These lines are often colored red and green,
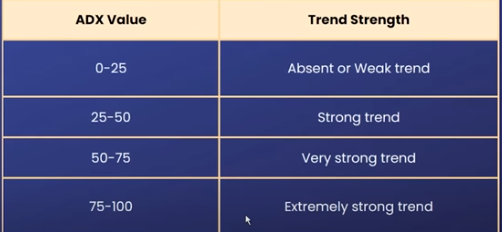
- ADX above 20 and DI+ above DI-. That’s an uptrend.
- ADX above 20 and DI- above DI+. That’s a downtrend.
- ADX below 20 is a weak trend or ranging period, often associated with the DI- and DI+ rapidly crisscrossing each other.
MACD moving average convergence divergence indicator
see the trend direction, as well as the momentum of that trend. It also provides a number of trade signals. When the MACD is above zero, the price is in an upward phase. If the MACD is below zero, it has entered a bearish period.
The indicator is composed of two lines: the MACD line and a signal line, which moves slower. When MACD crosses below the signal line, it indicates that the price is falling. When the MACD line crosses above the signal line, the price is rising.

Relative Strength Index RSI Indicator
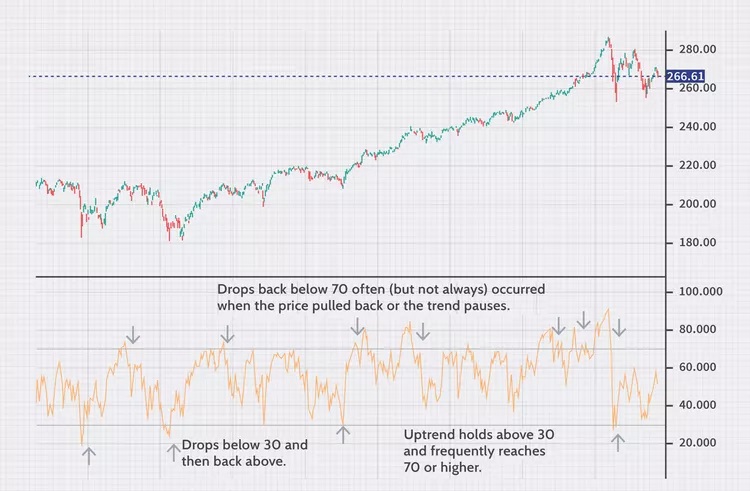
The indicator moves between zero and 100, plotting recent price gains versus recent price losses. The RSI levels therefore help in gauging momentum and trend strength.
price & time valuates.
RSI in week use 7 instead of 14.
Divergence is another use of the RSI. When the indicator is moving in a different direction than the price, it shows that the current price trend is weakening and could soon reverse.
A 3rd use for the RSI is support and resistance levels. During uptrends, a stock will often hold above the 30 level and frequently reach 70 or above. When a stock is in a downtrend, the RSI will typically hold below 70 and frequently reach 30 or below.
Stochastic Oscillator
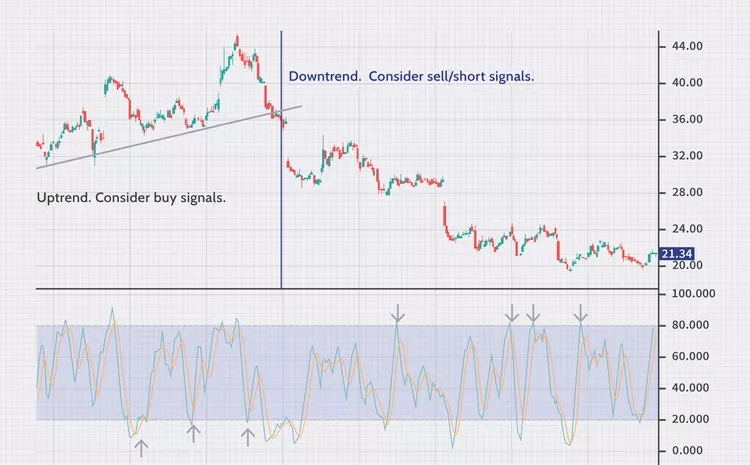
measures the current price relative to the price range over a number of periods. Plotted between zero and 100, the idea is that the price should make new highs when the trend is up. In a downtrend, the price tends to make new lows. The stochastic tracks whether this is happening
Values above 80 are considered overbought, while levels below 20 are considered oversold.
Is Technical Analysis Reliable?
but the range of success is varied and its accuracy remains undecided. It is best to use a suite of technical tools and indicators in tandem with other techniques like fundamental analysis to improve reliability.