1. Swing Trading Strategy Relative strength
1. Sector with relative strength/momentum
2. Stock with relative strength
3. Support resistance
4. Risk reward
check momentum in sector, and then momentum in stock,
use support and resistance as a Stoploss.
Trail the stoploss… if consolidate long term use Relative strength the indicator.. or RSI indicator exit below 50.. trail upto 90.
Source video
52 week high trading strategy
scan the 52 week high price stocks with market cap and other parameters on trading view, screener etc.
buy and hold unitl the trend reversal or target price reaches. use technical indicators like RSI MA, MACD, super trend etc.
exit: 200 day EMA or consolidation ex: 1 week or month.
ALL time High Trading strategy
all time high same as 52 week high strategy, but better when compared to 52 week high, less stocks available for trade.
pick 20 stocks 5% each money, no stoploss,
5% technically a stoploss.
or each 2% in 50 stocks.. because 45% will go up remaining hits stoploss… (its another strategy)
2. Swing Trading with Moving Averages (20,50,200)
Short term trend 20 days 1 month
Mid term trend: 50 days 3 months
long term trend 200 days 1 year
20 / 21 period: The 21 moving average is my preferred choice when it comes to short-term swing trading. During trends, price respects it so well and it also signals trend shifts.
50 period: The 50 moving average is the standard swing-trading moving average and very popular. Most traders use it to ride trends because it’s the ideal compromise between too short and too long term.
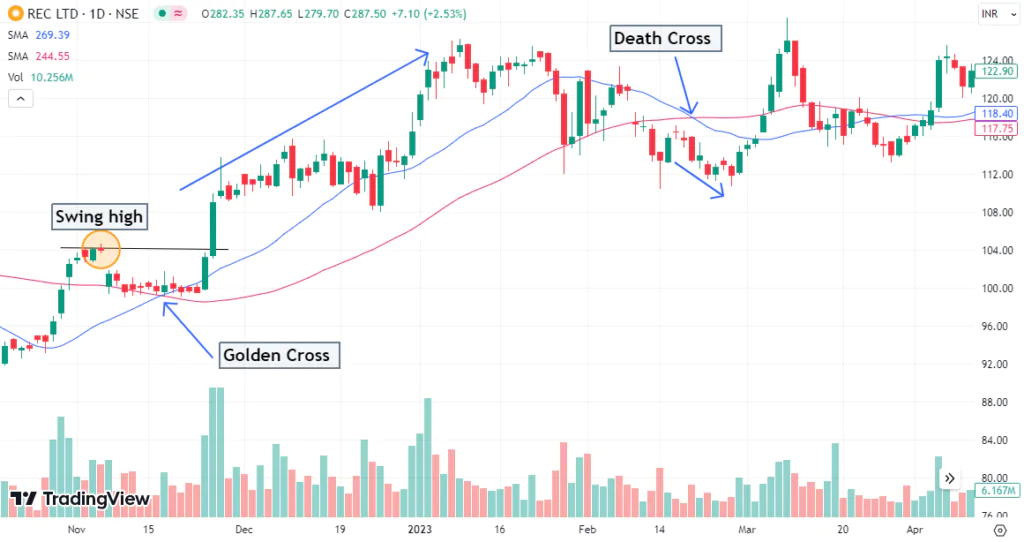
Buy when 200 EMA crosses 50 days Moving Average EMA or SMA
sell: 20 day crosse below 50 Day moving average or 20EMA crosses 200 EMA or 50EMA crosses 200EMA.
3. RSI Indicator
buy RSI above 50+
Sell RSI above 90 or
Stoploss RSI Below 50.
MACD Indicator
BOLLINGER BANDS Strategy
20days SMA default
standard deviation 2
upper line +20day SMA,
lower line -20 days SMA
buy on lower band and sell on middle or upper band.
Conclusion: Traders must test this, and implement their own by mixing with other indicators, also with fundamentals. these days momentum trading strategies are so popular its type of swing trading.
FAqs
Best time frame for swing trading?
The best time frame for swing trading if you have just started investing is between 6 months to 1 year. The best time frame for swing trading in particular is typically the daily or weekly charts.