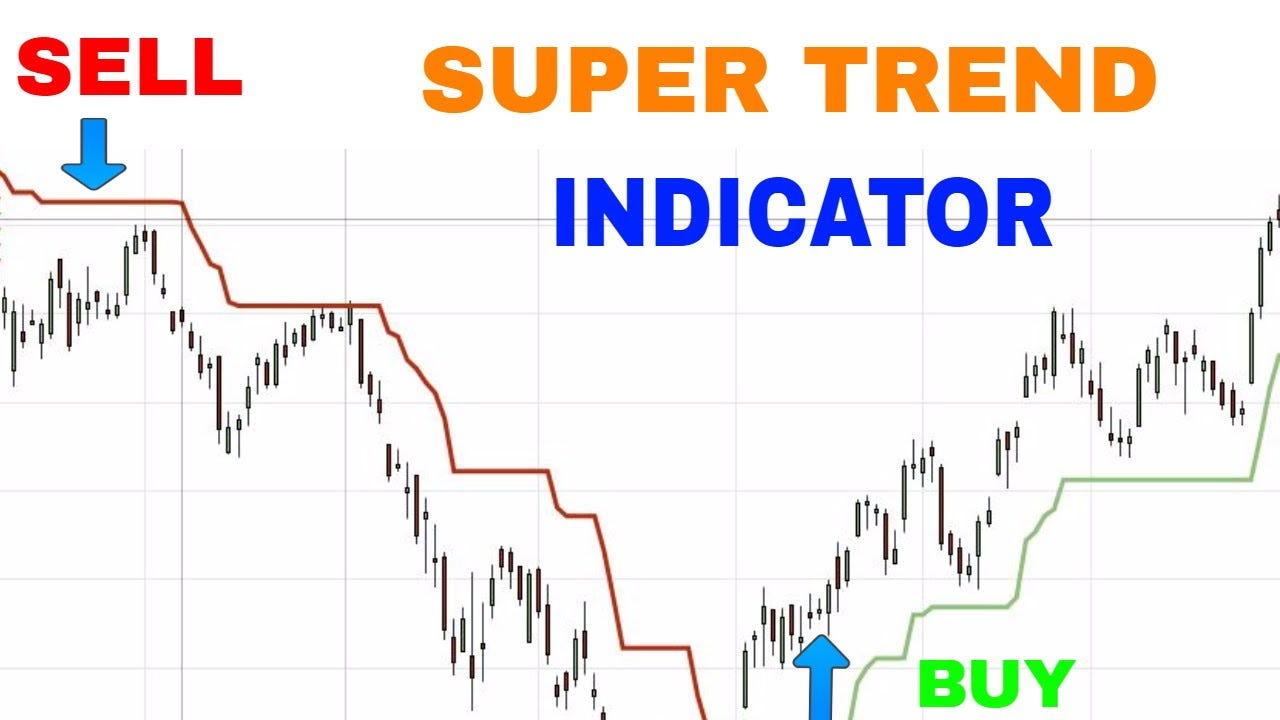
What is
its a trend indicator to spot the trend, trail stop loss and support or resistance of a time over a time period . its lagging indicator based on Average ture range ATR which relies on moving averages,
How to it works?
combines the average true range (ATR) with a multiplier to calculate its value. Super Trend Indicator combines different time frames into one, which allows you to see if a trend will continue or not from one time frame to another.
ATR length: 10
Multiplier: 3 (as per setup)
default parameters 10 periods and Multiplier 3.

Supertrend Indicator formula
Upper Band = (High + Low)/2 + multiplier x ATR,
Lower Band = (High + Low)/2 – multiplier x ATR
- High and low: These are the highest and lowest prices of the stock during a specified time frame.
- ATR: ATR measures volatility. calculated based on the highest and lowest prices,+ closing price of the asset over a specified time frame.
ATR Formula
(true range )TR = Max [(current high – current low), Absolute (current high – previous close), Absolute (current low – previous close)]
ATR: [(Prior ATR X 13) + Current TR]/14
Here, 14 indicates a period. Hence, the ATR is derived by multiplying the previous ATR with 13. Add the latest TR and divide it by period.
- Multiplier: This is a constant value that traders and investors employ to push the indicator to be more or less sensitive to price movements.
A higher multiplier makes the indicator less sensitive to price changes and reduces false signals. lower more sensitive faster indication but prone to false signals.
How to use Supertrend indicator?
for long positions Entry when the price above the Super trend (). exit when the price above the below trend .
uses
Supertrend also works as a trailing stop-loss for the existing trades and also acts as strong support or resistance.
Settings intraday to daily or weekly charts
The default settings for the Super trend indicator are 10 days for the average true range (ATR) value and 3 for the multiplier
supertrend indicator settings for intraday
1o minutes chart default parameter is a period of 10 (10 minutes average true range ATR ) and 3. (backtest)
supertrend indicator settings for weekly charts
The default settings for the Super trend indicator are 10 weeks for the average true range (ATR) value and 3 for the multiplier
10 weeks = 50 trading sessions as per NSE 5 trading sessions per week,
You can tweak the setting as per setup and goals.
limitations
its a trend follower, not for range-bound strategies or identifying overbought or oversold conditions.
Strategies
Super trend and moving averages strategy:
buy when super trend turn green and 5 EMA above 20EMA,
sell: super trend turns red 5 EMA below 20 EMA.
intraday 10 mins time frame (adjust according to setup and back test) similar 50,200 EMA fir swing and position trading.
super trend 10 periods and 3 multiplier.
RSI + Super trend