What is the Dual Momentum Trading Strategy? Dual momentum trading strategy helps you to compare the two assets and pickup of the one who has high momentum. ex: equity vs debt or equity vs debt or etfs in different sectors. absolute momentum: compares itself, ex: price of stock its previous period. Relative momentum: compares two types or assets ex: equity vs … [Read more...] about dual momentum investing Strategy by by Gary Antonacci
52 week high trading strategy
52 week high and low may used as support and resistance level by some traders. Traders also use near the high or the low end of its 52-week price range. calculate the “percentage off the 52-week high,” from 52 week low. How to calculate the 52-week high current stock price - 52 week high /10 strategy 1 52 week high momentum find the 52 week … [Read more...] about 52 week high trading strategy
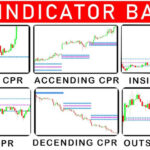
cpr indicator How to use how it works
What is Central Pivot Range (CPR)? The Central Pivot Range (CPR) is an indicator to identify key price points to set up trades. CPR is beneficial for intraday trading. Before you understand the CPR, it is important for you to know the Support and Resistance; how cpr works? CPR indicator comprises 3 levels. The pivot points at the top and bottom of these levels are the … [Read more...] about cpr indicator How to use how it works
sector rotation strategy etf
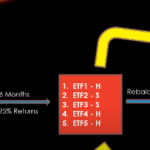
Sector Rotation Strategies Cyclical v/s Defensive: Cyclical sectors, like technology and consumer discretionary, tend to do well during economic expansions, while defensive sectors, like healthcare and utilities, may outperform during economic contractions. Relative Strength: select sectors based on their recent performance relative to the broader market or … [Read more...] about sector rotation strategy etf
position trading time frame chart setup weekly daily hourly
will need to use multiple time frames to assist with your trading. 1 hour charts, Daily charts, and Weekly charts. investment horizon(the length of time that an investor is willing to hold the portfolio) should be the primary time frame of your analysis. long term investing : 5-10 years chart or not necessary: intraday: 5-15 minutes chart Short time down trend may … [Read more...] about position trading time frame chart setup weekly daily hourly

