What Is MACD? – Moving Average Convergence/Divergence
momentum oscillator
How this indicator works
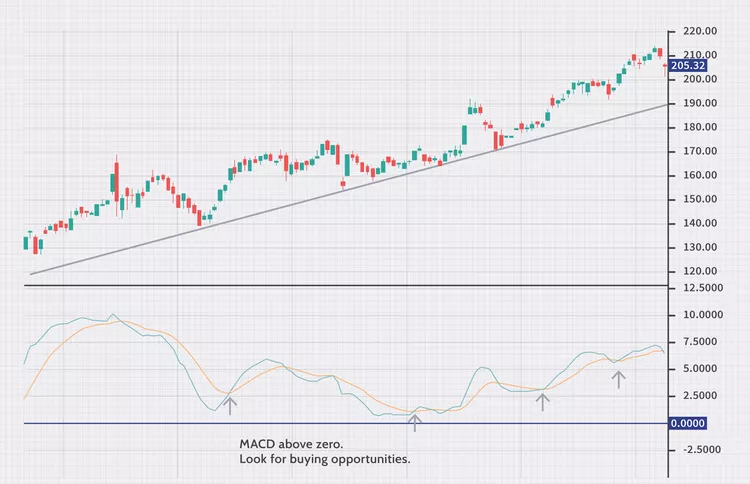
bullish
- MACD crossing above zero is considered bullish, while crossing below zero is bearish.
When the MACD line crosses from below to above the signal line, the indicator is considered bullish. crossing above to below bearish signal.
- Divergence between the MACD and the price action is a stronger signal when it confirms the crossover signals.
macd formula
by default MACD line can be calculated by subtracting the value of a 26 period Exponential Moving Average (EMA) from a 12 period EMA. The shorter EMA is constantly converging toward, and diverging away from, the longer EMA. This causes MACD to oscillate around the zero level. A signal line is created with a 9 period EMA of the MACD line.
You can adjust the parameters based upon your own criteria.
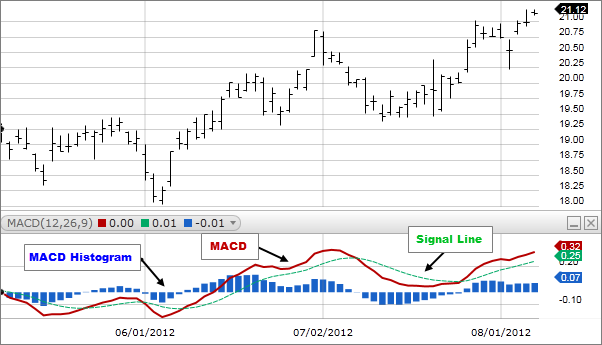
macd histogram explained
A MACD histogram is a bar chart that shows the difference between the MACD and its signal line.
How Do You Calculate the MACD Histogram?
MACD: (12-day EMA – 26-day EMA) Signal Line: 9-day EMA of MACD MACD Histogram: MACD – Signal Line
The histogram is positive when MACD is above its 9-day (signal line) EMA and negative when MACD is below its 9-day (signal line).
the MACD-Histogram crosses the zero line as MACD crosses below its signal line.
MACD VS RSI Indicator
There is overbought and oversold zone in MACD. RSI also consider the time along with the price. we can use both RSI MACD Signal to spot the trend.
MACD measures the relationship between two EMAs(26, 12), while the RSI measures price change in relation to recent price highs and lows
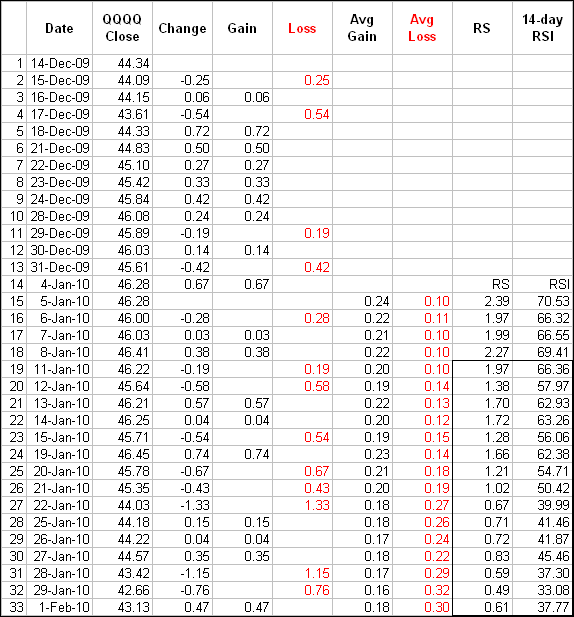
RSI formula
              100
    RSI = 100 - --------
                 1 + RS

    RS = Average Gain / Average Loss

or
- RSI = 100 – [100 ÷ ( 1 + (Average Gain During Up Periods ÷ Average Loss During Down Periods ))]
The first calculations for average gain and average loss are simple 14-period averages:
-
First Average Gain = Sum of Gains over the past 14 periods / 14.
-
First Average Loss = Sum of Losses over the past 14 periods / 14
The second and subsequent, calculations are based on the prior averages and the current gain loss:
-
Average Gain = [(previous Average Gain) x 13 + current Gain] / 14.
-
Average Loss = [(previous Average Loss) x 13 + current Loss] / 14.