What Are Fibonacci Retracement Levels?
Whenever the stock moves either upwards or downwards sharply, it usually tends to retrace back before its next move. For example, if the stock has run up from Rs.50 to Rs.100, it is likely to retrace back to probably Rs.70 before moving Rs.120.
The Fibonacci ratios, i.e. 61.8%, 38.2%, and 23.6%, help the trader identify the retracement’s possible extent.
Fibonacci discovered Fibonacci numbers.,
the series is the sum of the previous two numbers.
The Fibonacci sequence is as follows:
0 , 1, 1, 2, 3, 5, 8, 13, 21, 34, 55, 89, 144, 233, 377, 610…
Divide any number in the series by the previous number; the ratio is always approximately 1.618.
when a number is in the Fibonacci series is divided by its immediate succeeding number. 0.618 or 61.8%.
It is believed that the Fibonacci ratios, i.e. 61.8%, 38.2%, and 23.6%, finds its application in stock charts.
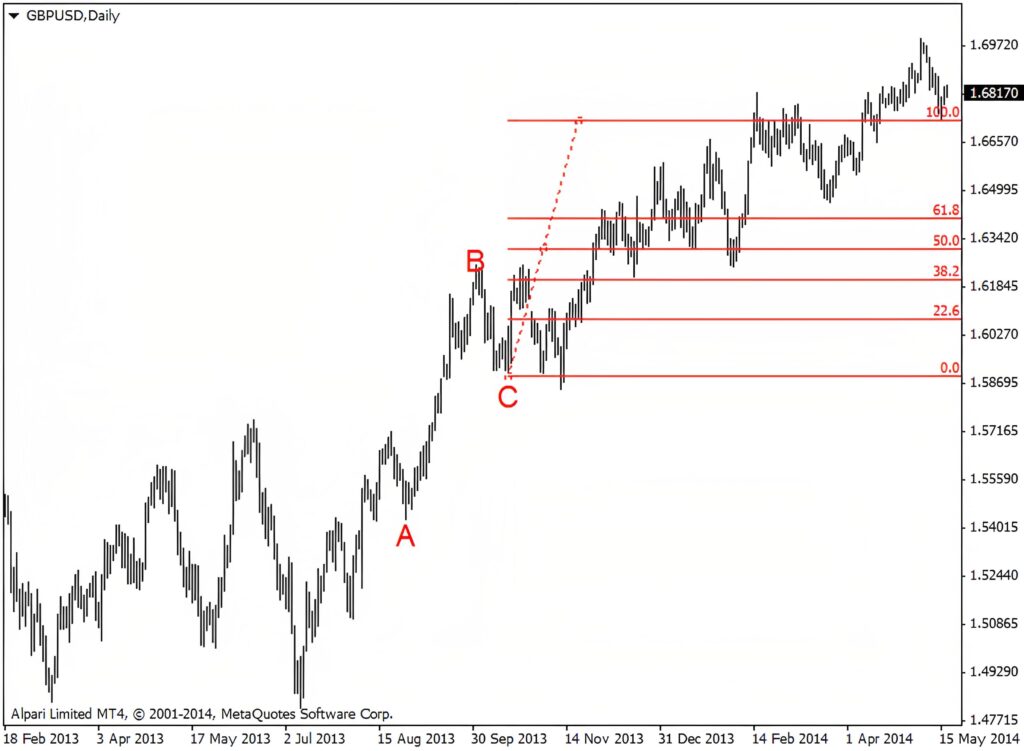
Fibonacci retracement levels are horizontal lines that indicate where support and resistance are likely to occur.
How does the Fibonacci retracement work?

it can be drawn between any two significant price points, such as a high and a low.
The Fibonacci retracement levels are 23.6%, 38.2%, 61.8%, and 78.6%
fibonacci retracement strategy
fibonacci retracement golden ratio
The golden ratio is the ratio between 1.618 and 1