multiple timeframes analysis trading view
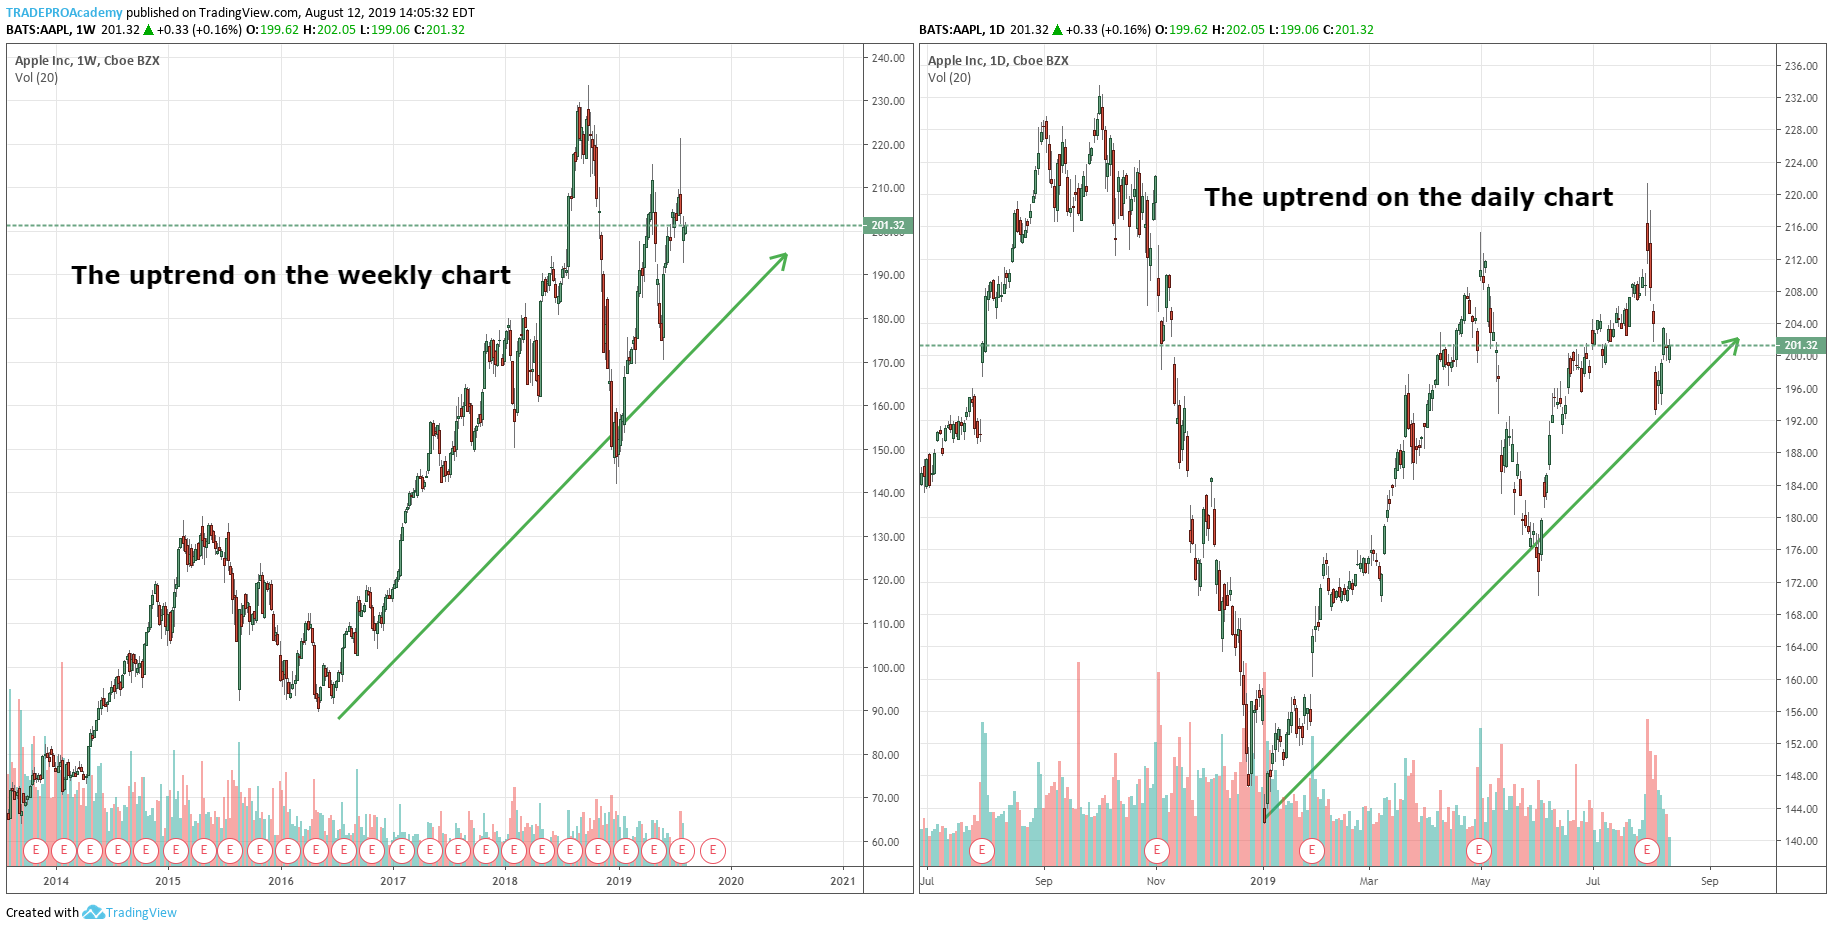
Trend Direction Identification on weekly chart & daily chart
Beginning with the weekly chart and ending at the 1-hour chart
weekly chart: uptrend, printing higher highs and higher lows. and spot the support & resistance levels.
daily timeframe: looking for for pullback but trading at weekly resistance level.
4 hour time frame: price trading some higher above the daily trade.
1 hour time frame: price trading bit higher than 4 hour time frame. entry defined here.

broad identification of trend on weekly chart, then further analysis of micro trend on daily chart
if both trends is pointing in the same direction

weekly, daily and four-hour chart. You are more likely to hold onto or look for a position for an at least six months or longer.
four-hour and work down to a fifteen-minute. You are probably going to hold the trade for a few days.
entry:
weekly>>daily and four hour analysis
4 hours chart we spot the pullback level.
hourly chart entry if you are not full time trader, 15 minutes analysis or entry.
exit plans
finding weak trend on weekly trend and analyze it daily hourly then exit..