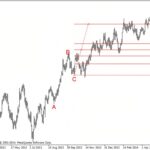
What Are Fibonacci Retracement Levels? Whenever the stock moves either upwards or downwards sharply, it usually tends to retrace back before its next move. For example, if the stock has run up from Rs.50 to Rs.100, it is likely to retrace back to probably Rs.70 before moving Rs.120. The Fibonacci ratios, i.e. 61.8%, 38.2%, and 23.6%, help the trader identify the … [Read more...] about fibonacci retracement levels
indicators
vwap trading strategy intraday indicator
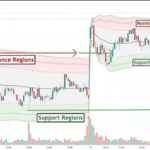
what is VWAP (Volume-weighted average price)? VWAP is a ratio of the cumulative share price to the cumulative volume traded over a given time period. (typically intra day) VWAP Formula? add the high, low, and close, then divide by three. Multiply this by the volume for that period VWAP = Cumulative Typical Price x Volume/Cumulative Volume Where Typical Price = … [Read more...] about vwap trading strategy intraday indicator
cpr indicator How to use how it works
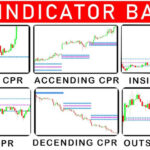
What is Central Pivot Range (CPR)? The Central Pivot Range (CPR) is an indicator to identify key price points to set up trades. CPR is beneficial for intraday trading. Before you understand the CPR, it is important for you to know the Support and Resistance; how cpr works? CPR indicator comprises 3 levels. The pivot points at the top and bottom of these levels are the … [Read more...] about cpr indicator How to use how it works
supertrend indicator how to use how it works
What is its a trend indicator to spot the trend, trail stop loss and support or resistance of a time over a time period . its lagging indicator based on Average ture range ATR which relies on moving averages, How to it works? combines the average true range (ATR) with a multiplier to calculate its value. Super Trend Indicator combines different time frames into one, … [Read more...] about supertrend indicator how to use how it works
what is bollinger bands How to use, how it works
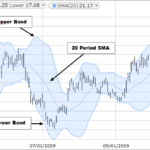
What is Bollinger band? Its a volatility indicator, Bollinger Bands are envelopes plotted at a standard deviation level above and below a simple moving average of the price. Because the distance of the bands is based on standard deviation, they adjust to volatility swings in the underlying price. Bollinger Bands use 2 parameters, Period and Standard … [Read more...] about what is bollinger bands How to use, how it works


