What is Bollinger band?
Its a volatility indicator,
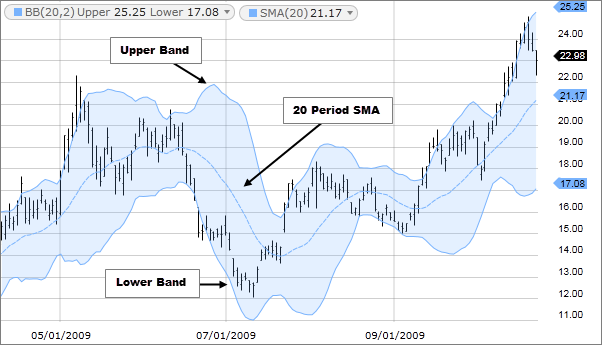
Bollinger Bands are envelopes plotted at a standard deviation level above and below a simple moving average of the price. Because the distance of the bands is based on standard deviation, they adjust to volatility swings in the underlying price.
Bollinger Bands use 2 parameters,
- Period and Standard Deviations,
- StdDev. (default 2)
- The default values are 20 for period, and 2 for standard deviations.
How Bollinger band works?
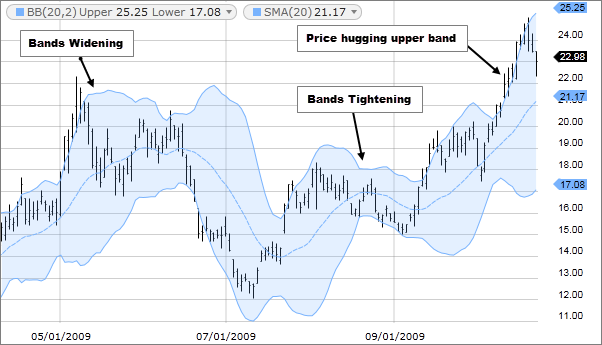
- Two bands tight then there is low volatility then there is a probability to trend either up or down.
- when bands are large due to volatility existing trend may end.
- Strong trend indicated when the price moves out of the band either up or down trend.

How to use bollinger band?
first select moving average ex: 20SMA
Short term: 20 day moving average, bands at 1.5 standard deviations. (1.5 times the standard dev. +/- the SMA)
Medium term: 50 day moving average, bands at 2 standard deviations.
Long term: 200 day moving average, bands at 3 standard deviations.
Add Standard deviation
- Add Standard Deviation + to SMA upper band
- subtract standard deviation from SMA for lower band

bollinger bands formula
- Upper band: 20-day SMA + (20-day SD x 2)
- Middle band: 20-day SMA
- Lower band: 20-day SMA – (20-day SD x 2
The default for Bollinger bands is 20-day SMA calculation and ± 2 standard deviations.
bollinger bands settings for daily weekly monthly charts
- Scalpers (minutes): Use a 10 period moving average with 1.5 standard deviations
- Day traders: Use a 20 period moving average with 2 standard deviations
- Swing traders(2 days to weeks): Use a 50 period moving average with 3 standard deviations
- Position traders(weeks to months): Use a 200 period moving average with 3 standard deviations
Advantages of bollinger band
Generally, we use 20,50 and 200 day Moving averages to spot the trend, but with Bollinger band we can spot the trend within range. somewhat useful just like other indicators. advise to test and deploy on your strategy. make your chart setup clean not cumbersome.
rsi and bollinger bands strategy
Generally RSI 30 & Bollinger band lower band consider as a buy signal, RSI 70+ and Bollinger band upper band as a Uptrend or a sell signal.
you may tweak the standard deviation, time frame on daily weekly chart etc.