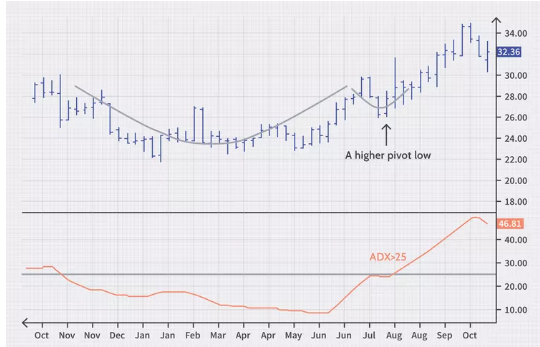
what Is ADX?
Average Directional Index (ADX), Its a trend indicator, used to know trend strength,
ADX calculations are based on a moving average of price range expansion over a given period of time. The default setting is 14 bars or periods it could be minutes, hours, daily frame etc.
How ADX Works?
The Plus Directional Indicator (+DI) and Minus Directional Indicator (-DI) are derived from smoothed averages of these differences and measure trend direction over time. These two indicators are often collectively referred to as the Directional Movement Indicator (DMI).
The Average Directional Index (ADX) is in turn derived from the smoothed averages of the difference between +DI and -DI; it measures the strength of the trend (regardless of direction) over time.
When the +DMI is above the -DMI, prices are moving up, and ADX measures the strength of the uptrend. When the -DMI is above the +DMI, then adx measures strength of the downtrend.
| ADX Value | Trend Strength |
| 0-25 | Absent or Weak Trend |
| 25-50 | Strong Trend |
| 50-75 | Very Strong Trend |
| 75-100 | Extremely Strong Trend |

important points
A falling ADX, when the price is rising, signifies that the trend is losing momentum, but the uptrend continues.
- ADX tells you when a breakout is strong enough to trend. When ADX rises above 25, it is a strong trend to follow.
- determine when a breakout is strong enough to trend or false breakout.
Crossovers
A buy signal occurs when +DI crosses above -DI, A sell signal triggers when -DI crosses above +DI.
limitations
ADX is based on moving average, which is a laggard indicator, meaning ADX is also very slow,
Combining ADX with Other Indicators
ADX and RSI
Buy price is drifting lower ADX reading of below 25, and when the RSI is showing oversold conditions. Similarly, a sell order can be placed when the price is edging higher, with an ADX reading of below 25 and when the RSI is showing overbought conditions.
ADX and Parabolic SAR
Parabolic SAR is a leading trend following indicator, and when combined with ADX, it could help traders to capture maximum returns in a trending market. ADX crossovers can take time to form in the market, and traders can enter a trending market early with Parabolic SAR when 3 consecutive parabolas are printed in the direction of the trend. Similarly, an early exit signal can be identified by Parabolic SAR when the parabolas flip onto the opposite side of the trend. This can be used instead of waiting for the +DI and -DI crossovers.
ADX and MACD
A signal to buy will be triggered when the MACD rises above the zero, line with the ADX rising above 20 and the +DI line crossing above –DI line. Similarly, a signal to sell will be triggered when the MACD falls below the zero line, with the ADX rising above 20 and the -DI line crossing above the +DI line.
ADX Settings
ADX Strategies
history
Wilder designed his Directional Movement System with commodities and daily prices in mind, these indicators can also be applied to stocks.