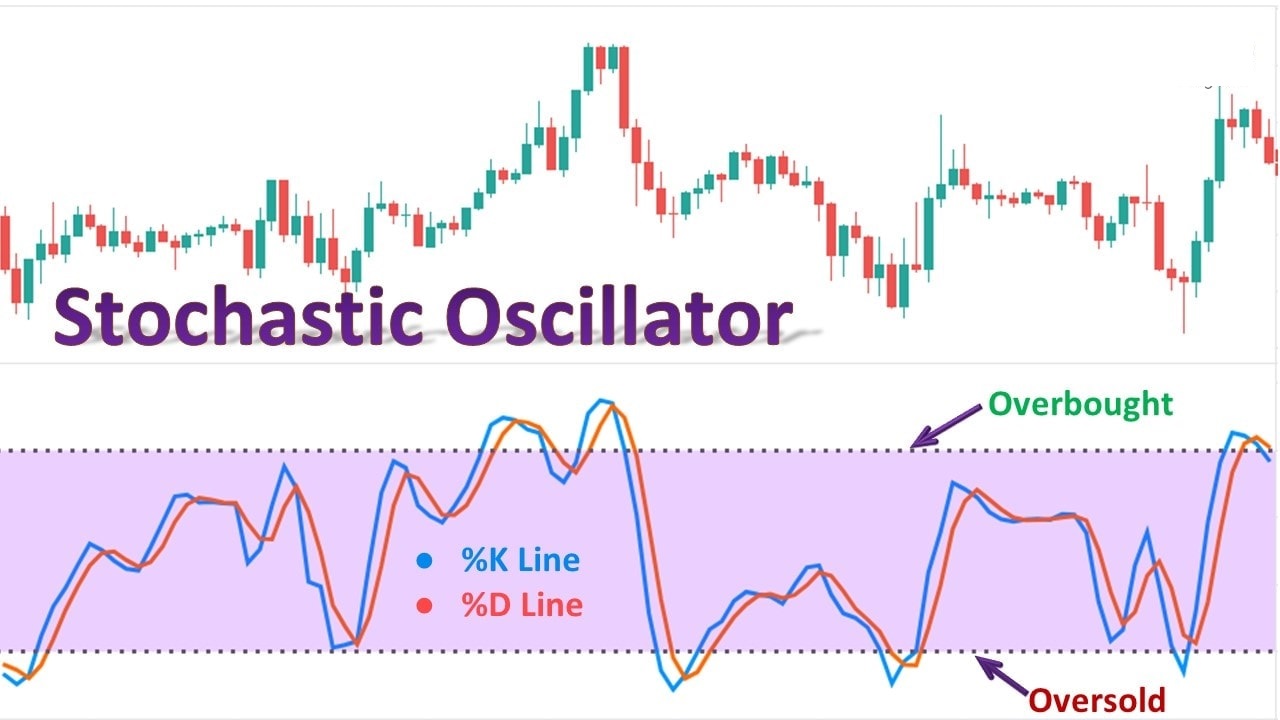
What is it?
momentum indicator, oscillates between 0-100 levels.
20 Indicates oversold zone, 80 indicates overbought zone in a 14 periods of time Moving averages. (14 minutes or 14days or 14 weeks etc)

stochastic indicator settings
The default settings are 5, 3, 3.
Other commonly used settings for Stochastic include 14, 3, 3, and 21, 5, 5.
Stochastic is often referred to as Fast Stochastic with a setting of 5, 4,
Slow Stochastic with a setting of 14, 3,
Full Stochastic with a setting of 14, 3, 3.
stochastic oscillator settings for 5 min chart 8, 3, 3.
The most commonly used settings for swing trading with a stochastic oscillator are 14, 3, 3
14 period, 3 periods average, 3 period smoothing average applied to %K.
Stochastic Oscillator Formula
- Stochastic: = 100 x ((C – L)/(H – L))
- Signal: = average of the last three Stochastic values
where: C = The most recent closing price,
L = The lowest price traded of the previous trading sessions,
H = The highest price traded during the same -day period,
%K = The current value of the stochastic indicator
5% Per Month With Stochastic Indicator by trading with vivek
- %K Length : 4 (default is 14)
- %K Smoothing : 3 ( default is 1)
- %D Smoothing : 3( default is also 3)
- Upper band 80, lower band 20 (remove middle band 50)
- Buy condition: both Blue & orange line is below 20(lower horizontal line).
- Trade around 3:20_3:25PM time.
- Downward avg after 5%. with same investment (it just a 1 trade of your overall portfolio)
- sell Condition: sell at 5% on overall investment.
- Problem: Consolidation (ex: 5% in 9 months).. solution: diversify trades.
RSI vs. Stochastic indicator
both price momentum oscillators, but uses different theories, it may better to use with both to confirm the trend.
- stochastic predict the trend based on closing price on same trend. useful in sideways and rangebound markets.
- RSI measures the speed of price movements. useful in trending markets.