Common Positional Trading Strategies
- Support and Resistance
- Breakout Trading Strategy
- 50-days and 200-days EMA Crossover
- Pullback and Retracement Trading Strategy
- Range Trading
- Risk-Reward In Positional Trading
Beginner Positional Trading Strategy
Stocks to screen: 52 Week High or All time high , & 50 EMA Crosses 200EMA
Chart time frame: weekly, monthly
Super trend + ADX (momentum indicator)
Entry: ADX: above 25, and super trend green on monthly chart
Exit: on weekly time frame (profit to gain years, loss in 1 month) Trailing stoploss or super trend.
PE Ratio Based on Positional trading Nifty 50
Average Nifty PE: 25 Years means (25% return every year… buying 1 rupee with 25 rupees to expect it grow).
| PE Ratio | quantity |
| upto 10 | 5 as much as possible |
| 10-15 | 4 |
| 15-20 | 3 |
| 20-25 | 2 |
| 25-30 | 1 |
| 30-35 | 0.5 |
| 35-40 | 0.25 |
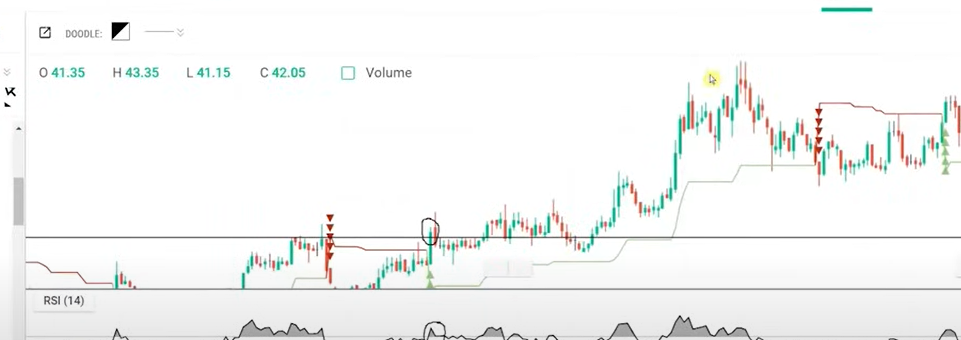
RSI + Super trend Indicators For Weekly Chart
Entry: RSI Breakout at 60 + and super trend green at a time.
Exit: preferred trailing to stoploss previous candle low (to avoid large pull back) or super trend red (7,3) may up to be -20% SL.

Positional Trading Timeframe:
few months to a few years.